Sydney properties is the hottest real estate market in Australia. Given the landlocked nature of Sydney where growth in limited to towards West, limited housing supply for a number of years and low interest rates. All these factors contributed to the strong performance of property prices in Sydney over the last 3 years.
We have highlighted a couple interest points to provide some perspective on where we are in the cycle and indicators which can provide potential property market forecast on future price direction.
We are cautious of residential real estate as an asset class. Given the inherent leverage and cyclical nature of returns. Yes, property prices can down. Only because we have not had a large property market correction does not mean Australia is immune to real estate cycles.
Median House Price Sydney

Chart above the Sydney median house price over the last 15 years. The median house price is at its highest at just over $1 million dollars.
It is important to understand the trend in house prices within the context of the Reserve Bank of Australia cash rate. The cash rate form the basis in which all mortgages rates are based on.
Property prices Sydney increased significantly leading up to 2000 Olympics. Since then it remained broadly flat between 2002 and 2008. We think the crash in share prices during the GFC, investors focused on real estate just like when property prices took off post the black Friday crash in 1987.
It is quite evident that since 2011, the inverse relationship between cash rate and Sydney house market have become more noticeable. This applies event to listed property trusts.
Sydney Property Prices Risks Increasing
Property is one of the easiest asset class where retail investors can invest using significant leverage. As the RBA cut rates, the lower cost of funding flows right through to the real estate markets. The cost of borrowing is the primary driver of property market Sydney rather than tax issues like negative gearing.
We have not shown the median apartment price in Sydney over time. However ratio of apartment price to median house value is around 67% over the long run. We expect the ratio to decline in the future given the upcoming supply are predominately apartments.
Given where we are in the cycle with interest rate at record lows. The low cost of mortgages have pushed up real estate prices to near record. We feel the easing cycle is over baring some unforeseen crises from China.
Key Risks to the Market
1. As further cuts are unlikely, the next change in interest rate is more likely to be up. The build up of leverage would exacerbate any decline in prices for those that are caught off guard.
2. Upcoming market supply is another issue we see that could limit further price gains. From where we are, we see a number of cranes for apartment developments in Sydney. We see market will struggle to absorb the onslaught of additional supply at this price level.
In addtion given our experience in the markets. Supply will overshoot on the upside before approvals slow down. Real estate cycles move slower than equities, it will take time before market stabilizes.
For example Western Australia prices has been weak for over a year and only now the supply responding to market conditions. It will be another year before the market can absorb the current supply. Sydney will be no different.
3. NSW government has proposed additional stamp duty on property purchasers for foreign investors. Given the that foreign investors are only allowed invest in new dwellings which was the primary driver of the increase supply. Additional stamp duty will damper already challenging factor facing the market.
4. Banks are more conservative in mortgage lending. A crack on down foreign borrower lending while only affect small segment of market does not help overall sentiment.
All theses factors add up to a view that housing price increases will not have the same tailwind it saw in the last 4 years.
Sydney Auction Clearance Rate
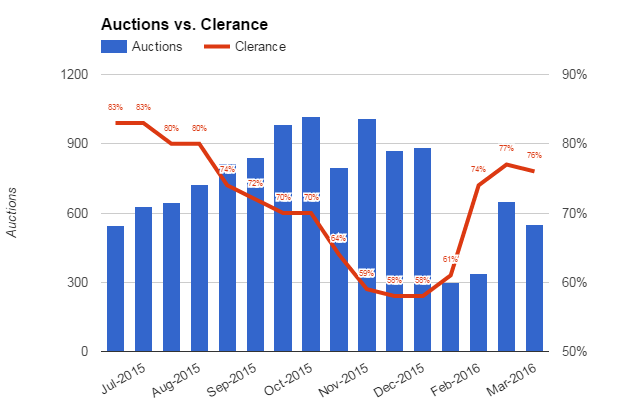
Chart above shows the 9 month Sydney clearance rate. The number of houses put on auction is seasonal where the busiest season is Spring, weakest post Christmas and the month of January.
Various residential market data providers calculate the auction rate differently however most follow the convention:
CLEARANCE RATE = (SOLD AT AUCTION + SOLD PRIOR TO AUCTION) / (ALL REPORTED + WITHDRAWN)
Note while the auction rate clearance is an key indicator of overall market condition. The common saying that all real estate is local means still applies. The decline in the clearance rate is more pronounced as you move out from the CBD.
Areas in Western Sydney, North west, South west, Bankstown and Central Coast are seeing low 60% and 70%. Strength is still seen in the inner CBD, Eastern suburbs and Lower North Shore in which 90% is still quite common.
The last big auction was the weekend before Easter. The market volume is expected to be steady until late Spring. 2016 auction clearance rate has not breached 80% overall even at lower than last year volumes.
Overall Sydney clearance rate has been declining since July last year. While pick up this year means that last 3 month average is around mid 70%, it is still a poor performance verses 2015.
This is within the context of record low interest rates. The banks have increased lending criteria and strictness against housing. This include expanding blacklist areas where meaningful supply is coming online and require larger deposits for purchases. This mean that heat could have already left the market.
The fall in ANZ share price as result of higher than expected bad debt will not help going forward. As banks will be continue to be cautious.
First Home Buyer
[visualizer id=”1826″]
The chart shows the proportion of first home buyer as % of total purchases. To us this is a key indicator of the health of the underlying market and housing affordability.
Interesting to see the breakdown of the trend in 2002 when the historical average of low 20% declined to mid teens. It is no surprise that the trend is inverse of house price growth.
The make up of FHB breached 30% during the GFC where investors pulled back residential investment purchases. Since then the trend is a gradual decline. The current level is approaching the nadir seen in 2004.