The technology sector is one key area of focus for us. This can be surprising to some as given the name of the website. We have been keenly watching the US tech IPO markets as the new generation of disruptors become public corporations. There has been much hype but the post IPO performance have been wanting.
Technology stocks are usually selling the dream. They promise that the market is huge and they will become the leader in their respective sectors. Just look at Linkedin, Google and Amazon. However as investors our focus is seeing that market dominance translated in to earnings and cash flow.
There is no guarantee that they will deliver even after years in the public. Just look at Linkedin’s earnings which are minuscule verses what is indisputably sector leading company. Tesla with its eye watering cashburn. Google which we have followed for years translated it’s market dominance in search into earnings but only recently looked to be serious in managing its costs and plan beyond search.
Recent technology IPO’s have been mixed. Twitter is having trouble in landing on its feet in finding out what is next. BOX and Square funnily enough not only have similar sounding names in completely different sub sectors are burning through cash like no tomorrow.
That is not to say we don’t like their product from a user perspective, but from an investment perspective they are really pie in the sky with hockey stick growth. Only time and meaningful execution will tell if they become the next GOOG, MSFT or APPL or simply GPRO.
As an Australian, there are only a handful of tech companies that come from our humble shores. Majority of market capitalisation on the ASX are dominated by banks, materials and real estate. Atlassian (TEAM) is recently the most well known although we confess that we are typically not the products target market.
Similar in the vein on South 32 demerger we dug through the prospectus to try and understand what it is promising and what are we getting today. Since we known the broader sector abit and analyzed tech companies for awhile hopefully we can provide a meaningful overview.
Atlassian Overview
Simply Atlassian develop tools to make life of software developer easier. A producer of productivity enhancing software which make the end user more productive. Unlike existing enterprise like SAP and Oracle. The product is very niche and focused which in a sense can be more profitable. Especially with a focus on referral or word of mouth, it looks like the growth trajectory has simply gone viral from the beginning.
The products are sold as a combination of subscription or perpetual license.
Revenue, Average Sale Price and Segments
As with all Tech IPO’s revenue growth is the headliner. TEAM revenue has growth on avg 50% since 2013 to $319 mil in 2015. Interestingly at the same time base subscription revenue is only $86mil with perpetual license as 2nd largest revenue segment at $57mil. The largest revenue segment is actually maintenance revenue from existing subscribers.
| Average Sale Price | 2013 | 2014 | 2015 |
| Rev per Customer (Sub) | 1,040 | 1,369 | 1,767 |
| Rev per Customer (Maint) | 3,034 | 3,010 | 3,298 |
| Rev per Customer (Perpetual) | 1,185 | 1,186 | 1,180 |
| Total per Customer | 5,366 | 5,775 | 6,572 |
| Headcount | 533 | 763 | 1,259 |
| Customers | 27,676 | 37,250 | 48,622 |
We broke down revenue per customer on the table above. In aggregate it looks like revenue per customer has been increasing in the last 3 years. Rough understanding is that while initial purchase and users are small per customer as more users migrate to TEAM’s system, the network effect increases total subscribers.
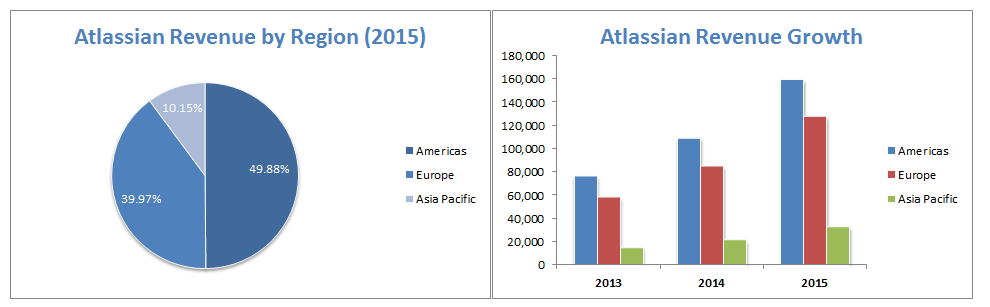
Further disclosure shows no wonder that TEAM decide to list on the NASDAQ rather than the ASX. Americas account for almost 50% of the total revenue.
Last 3 years of revenue growth shows while total growth rate is consistent across all regions at mid 40’s. The size of European and Americas market outpaces Asia Pacific significantly. It does not hedge foreign exchange exposure so Australian investors will be exposed to changes in the AUD/USD.
Where the money goes
The growth has been spectacular over the last 3 years.Chart below shows the breakdown of the annual revenue across 4 major expense categories and operating income.
Operating Income – while Atlassian made minor operating income in 2013/2014, it was broadly flat in 2015. Unlike other tech companies which it is common to see strong cash burn, losses stack up and funded by venture capital funds and investors until the business matures.
Management has stated that the business has been broadly profitable since the early years where limited capital were raised from outside venture capital firms.
This is signified by the management definition of free cash flow (Operating Cashflow – Capex) as $47mil in 2013, $67mil in 2014 and $66mil in 2015 or 31%, 31% and 20% of revenue in the last 3 years.
Operating income average 10% prior to 2015.
This raise the question why the company is going public? They don’t need the cash at this stage.
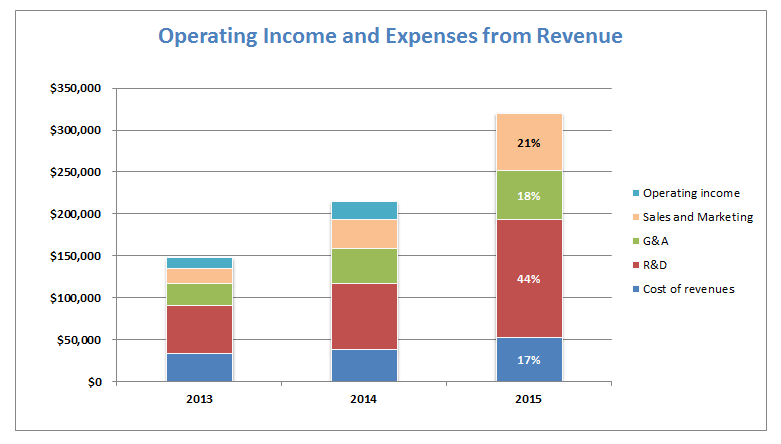
Sales and Marketing – We proffer they want to ramp up marketing as they have in the last 24 months to accelerate the growth. It is the only segement where the proportion of revenue has increased materially using the last 3 year trend from 13% to 21%.
From what we can tell S&M spend are for marketing rather than hiring direct sales consultants.
Research and Development – R&D spend is at 44% of revenue in 2015. It averages in low 40’s to mid 40’s in the historical period. Interesting that accounting policy is to expense R&D, while it can be capitalized under the usual rules however no R&D spend has been capitalized on the balance sheet.
As with any investments, we always have more questions. Here is a selection on what is on our mind.
- How long are typical contracts (1 year rolling), what is the Churn/Retention rate?
- What products are covered under perpetual licences vs subscription (typical payback period from user perspective?)
- Target steady state margin?
- Team does not collect VAT and Sales taxes. While typical for SaaS in NA. If EU crackdown on tax regime materializes, it would add incremental cost from user perspective.
Management stated they have no plans to initiate dividends in the near future. This is reasonable given opportunities in the sector.
TEAM looks interesting from the portfolio perspective as it adds non mining or energy exposure. Financially, it is on a sounder footing than the recent IPOs. Will watch this space and see how it trades post IPO before adding position.